
|
Screenshots
below |
July 29, 1998
By
Linda Von Schweber |
|
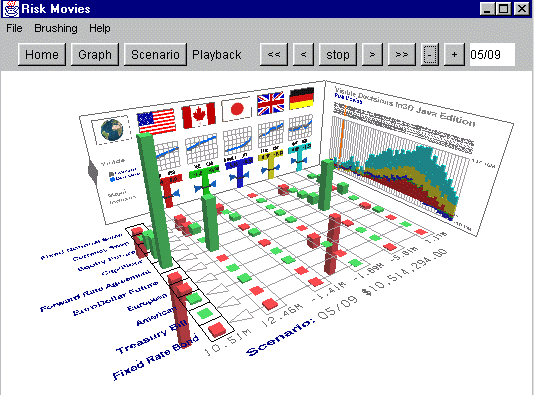
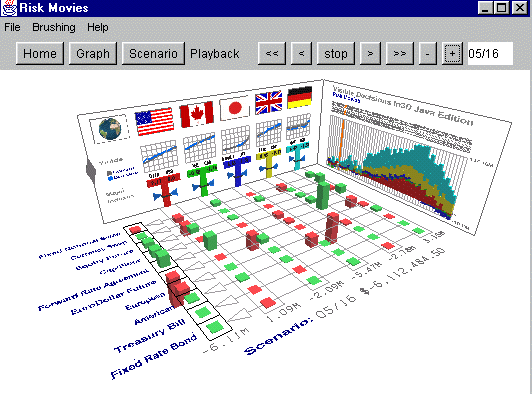
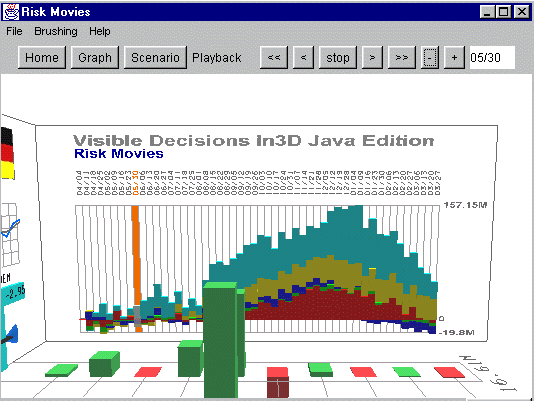
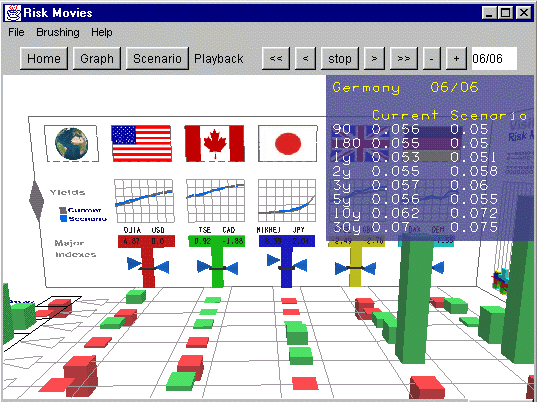
First are four of a nearly infinite variety of views available from
a single In3D Java Edition Risk Management application. All views work
off the same data. The VCR like controls animate the chart showing successive
weeks of financial risk management data. You can also select individual
weeks from the background bar chart. Drill down can present volumes
of data details by brushing the mouse over a point of interest.
|
|||
 |
|||
|
|||
|
|||
|
|
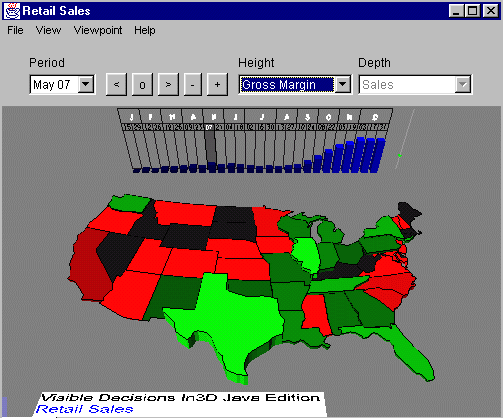
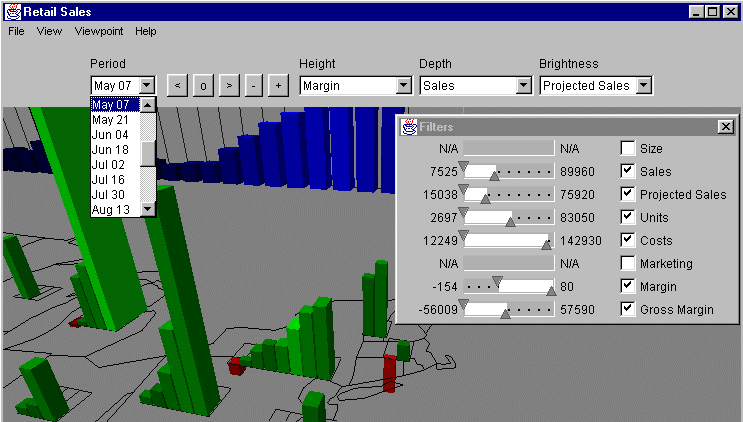
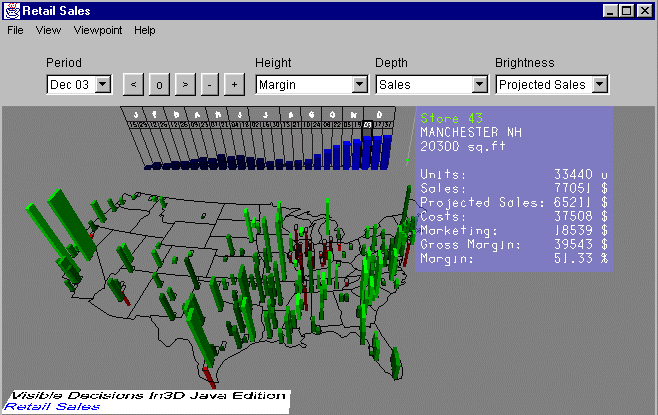
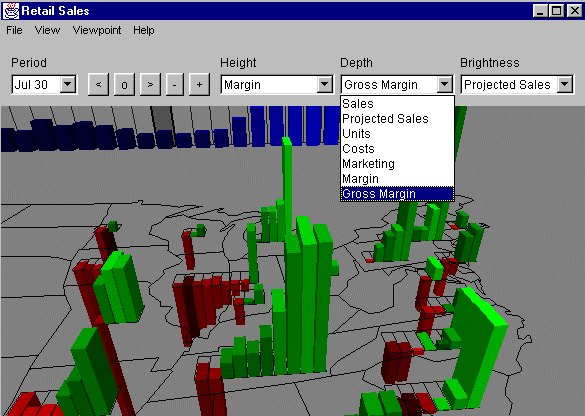
Another application written with Visible Decisions' In3D Java Edition toolkit. Next are four of a nearly infinite variety of views available from a single In3D Java Edition application for a Retail Operation. All views work off the same data. Use the blue barchart at the back to select a 2 week period. Select a view of state totals or individual stores. Filter the data, assign fields such as Gross Margin or Sales to Height, Depth, and Brightness. Drill down by brushing the mouse over a bar chart, sort data by state, reposition up close around the area of interest. |
||||
 |
||||
|
||||
|
||||
|
||||
|
To
Contact the authors send mail to
info@infomaniacs.com |
||||